*Backtesting System ⚉ OVERVIEW ⚉
One of the best Systems for Backtesting your Strategies.
Incredibly flexible, simple, fast and feature-rich system — will solve most of your queries without much effort.
Many systems for setting StopLoss, TakeProfit, Risk Management and advanced Filters.
All you need to do is plug in your indicator and start Backtesting .
I intentionally left the option to use my System on Full Power before you load your indicator into it.
The system uses the built-in simple and popular moving average crossover signal for this purpose. (EMA 50 & 200).
Also Highly Recommend that you Fully use ALL of the features of this system so that you understand how they work before you ask questions.
Also tried to leave TIPS for each feature everywhere, read Tips, activate them and see how they work.
But before you use this system, I Recommend you to read the following description in Full.
—————— How to connect your indicator in 2 steps:
Adapt your indicator by adding only 2 lines of code and then connect it to this Backtesting System.
Step 1 — Create your connector, For doing so:
• 1 — Find or create in your indicator where are the conditions printing the Long-Buy and Short-Sell signals.
• 2 — Create an additional plot as below
I'm giving an example with a Two moving averages cross.
Please replicate the same methodology for your indicator wether it's a MACD, RSI , Pivots, or whatever indicator with Clear Buy and Sell conditions.
//@version=5
indicator('Moving Average Cross', overlay = true)
MA200 = ta.𝚎𝚖𝚊(close, 200)
MA50 = ta.𝚎𝚖𝚊(close, 50)
// Generate Buy and Sell conditions
buy = ta.crossover (MA200, MA50)
sell = ta.crossunder (MA200, MA50)
plot(MA200, color=color.green)
plot(MA50 , color=color.red )
bgcolor(color = buy ? color.green : sell ? color.red : na, title='SIGNALS')
// ———————————————— SIGNAL FOR SYSTEM ————————————————
Signal = buy ? +1 : sell ? -1 : 0
plot(Signal, title='🔌Connector🔌', display = display.none)
// —————— 🔥 The Backtesting System expects the value to be exactly +1 for the 𝚋𝚞𝚕𝚕𝚒𝚜𝚑 signal, and -1 for the 𝚋𝚎𝚊𝚛𝚒𝚜𝚑 signal
Basically, I identified my Buy & Sell conditions in the code and added this at the bottom of my indicator code
Now you can connect your indicator to the Backtesting System using the Step 2
Step 2 — Connect the connector
• 1 — Add your updated indicator to a TradingView chart and Add the Backtesting System as well to the SAME chart
• 2 — Open the Backtesting System settings and in the External Source field select your 🔌Connector🔌 (which comes from your indicator)
_______________________________
⚉ MAIN SETTINGS ⚉
‾‾‾‾‾‾‾‾‾‾‾‾‾‾‾‾‾‾‾‾‾‾‾‾‾‾‾‾‾‾‾
𝐄𝐱𝐭𝐞𝐫𝐧𝐚𝐥 𝐒𝐨𝐮𝐫𝐜𝐞 — Select your indicator. Add your indicator by following the 2 steps described above and select it in the menu. To familiarize yourself with the system until you select your indicator, you will have an in-built strategy of crossing the two moving EMA's of 50 and 200.
Long Deals — Enable/Disable Long Deals.
Short Deals — Enable/Disable Short Deals.
Wait End Deal — Enable/Disable waiting for a trade to close at Stop Loss/Take Profit. Until the trade closes on the Stop Loss or Take Profit, no new trade will open.
Reverse Deals — To force the opening of a trade in the opposite direction.
ReEntry Deal — Automatically open the same new deal after the deal is closed.
ReOpen Deal — Reopen the trade if the same signal is received. For example, if you are already in the long and a new signal is received in the long, the trade will reopen. * Does not work if Wait End Deal is enabled.
𝐓𝐚𝐤𝐞 𝐏𝐫𝐨𝐟𝐢𝐭:
None — Disables take profit. Useful if you only want to use dynamic stoplosses such as MA, Fast-Trailing, ATR Trail.
FIXED % — Fixed take profit in percent.
FIXED $ — Fixed Take in Money.
ATR — Fixed Take based on ATR.
R:R — Fixed Take based on the size of your stop loss. For example, if your stop is 10% and R:R=1, then the Take would be 10%. R:R=3 Take would be 30%, etc.
HH / LL — Fixed Take based on the previous maximum/minimum (extremum).
𝐒𝐭𝐨𝐩 𝐋𝐨𝐬𝐬:
None — Disables Stop Loss. Useful if you want to work without a stop loss. *Be careful if Wait End Deal is enabled, the trade may not close for a long time until it reaches the Take.
FIXED % — Fixed Stop in percent.
FIXED $ — Fixed Stop in Money.
TRAILING — Dynamic Trailing Stop like on the stock exchanges.
FAST TRAIL — Dynamic Fast Trailing Stop moves immediately in profit and stays in place if the price stands still or the price moves in loss.
ATR — Fixed Stop based on the ATR.
ATR TRAIL — Dynamic Trailing Stop based on the ATR.
LO / HI — A Fixed Stop based on the last Maximum/Minimum extemum. Allows you to place a stop just behind or above the low/high candle.
MA — Dynamic Stop based on selected Moving Average. * You will have 8 types of MA (EMA, SMA, HMA, etc.) to choose from, but you can easily add dozens of other MAs, which makes this type of stop incredibly flexible.
Add % — If true, then with the "𝗦𝘁𝗼𝗽 %" parameter you can add percentages to any of the current SL. Can be especially useful when using Stop - 𝗔𝗧𝗥 or 𝗠𝗔 or 𝗟𝗢/𝗛𝗜. For example with 𝗟𝗢/𝗛𝗜 to put a stop for the last High/Low and add 0.5% additional Stoploss.
Fixed R:R — If the stop loss is Dynamic (Trailing or MA) then if R:R true can also be made Dynamic * Use it carefully, the function is experimental.
_________________________________________
⚉ TAKE PROFIT LEVELS ⚉
‾‾‾‾‾‾‾‾‾‾‾‾‾‾‾‾‾‾‾‾‾‾‾‾‾‾‾‾‾‾‾‾‾‾‾‾‾‾‾‾‾
A unique method of constructing intermediate Take Profit Levels will allow you to select up to 5 intermediate Take Profit Levels and one intermediate Stop Loss.
Intermediate Take Profit Levels are perfectly calculated into 5 equal parts in the form of levels from the entry point to the final Take Profit target.
All you need to do is to choose the necessary levels for fixing and how much you want to fix at each level as a percentage. For example, TP 3 will always be exactly between the entry point and the Take Profit target. And the value of TP 3 = 50 will close 50% of the amount of the remaining size of the position.
Note: all intermediate SL/TP are closed from the remaining position amount and not from the initial position size, as TV does by default.
SL 0 Position — works in the same way as TP 1-5 but it's Stop. With this parameter you can set the position where the intermediate stop will be set.
Breakeven on TP — When activated, it allows you to put the stop loss at Breakeven after the selected TP is reached. For this function to work as it should - you need to activate an intermediate Take. For example, if TP 3 is activated and Breakeven on TP = 3, then after the price reaches this level, the Stop loss will go to Breakeven.
* This function will not work with Dynamic Stoplosses, because it simply does not make sense.
CoolDown # Bars — When activated, allows you to add a delay before a new trade is opened. A new trade after CoolDown will not be opened until # bars pass and a new signal appears.
_____________________________
⚉ TIME FILTERS ⚉
‾‾‾‾‾‾‾‾‾‾‾‾‾‾‾‾‾‾‾‾‾‾‾‾‾‾‾‾‾
Powerful time filter code that allows you to filter data based on specific time zones, dates, and session days. This code is ideal for those who need to analyze data from different time zones and weed out irrelevant data.
With Time Filter, you can easily set the starting and ending time zones by which you want to filter the data.
You can also set a start and end date for your data and choose which days of the week to include in the analysis. In addition, you can specify start and end times for a specific session, allowing you to focus your analysis on specific time periods.
_________________________________
⚉ SIGNAL FILTERS ⚉
‾‾‾‾‾‾‾‾‾‾‾‾‾‾‾‾‾‾‾‾‾‾‾‾‾‾‾‾‾‾‾‾‾
Signal Filters — allows you to easily customize and optimize your trading strategies based on 10 filters.
Each filter is designed to help you weed out inaccurate signals to minimize your risks.
Let's take a look at their features:
__________________________________
⚉ RISK MANAGEMENT ⚉
‾‾‾‾‾‾‾‾‾‾‾‾‾‾‾‾‾‾‾‾‾‾‾‾‾‾‾‾‾‾‾‾‾‾
Risk management tools that allow you to set the maximum number of losing trades in a row, a limit on the number of trades per day or week and other filters.
Loss Streak — Set Max number of consecutive loss trades.
Win Streak — Max Winning Streak Length.
Row Loss InDay — Max of consecutive days with a loss in a row.
DrawDown % — Max DrawDown (in % of strategy equity).
InDay Loss % — Set Max Intraday Loss.
Daily Trades — Limit the number of MAX trades per day.
Weekly Trades — Limit the number of MAX trades per week.
* 🡅 I would Not Recommend using these functions without understanding how they work.
Order Size — Position Size
• NONE — Use the default position size settings in Tab "Properties".
• EQUITY — The amount of the allowed position as a percentage of the initial capital.
• Use Net Profit — On/Off the use of profit in the following trades. *Only works if the type is EQUITY.
• SIZE — The size of the allowed position in monetary terms.
• Contracts — The size of the allowed position in the contracts. 1 Сontract = Сurrent price.
________________
⚉ NOTES ⚉
‾‾‾‾‾‾‾‾‾‾‾‾‾‾‾‾
It is important to note that I have never worked with Backtesting and the functions associated with them before.
It took me about a month of slow work to build this system.
I want to say Big Thanks:
• The PineScripters🌲 group, the guys suggested how to implement some features. Especially @allanster
• Thanks to all those people who share their developments for free on TV and not only.
• I also thank myself for not giving up and finishing the project, and not trying to monetize the system by selling it. * Although I really want the money :)
I tried hard to make it as fast and convenient as possible for everyone who will use my code.
That's why I didn't use any libraries and dozens of heavy functions, and I managed to fit in 8+-functions for the whole code.
Absolutely every block of code I tried to make full-fledged modular, that it was easy to import/edit for myself (you).
I have abused the Ternary Pine operator a little (a lot) so that the code was as compact as possible.
Nevertheless, I tried very hard to keep my code very understandable even for beginners.
At last I managed to write 500 lines of code, making it one of the fastest and most feature-rich systems out there.
I hope everyone enjoys my work.
Put comments and write likes.
在腳本中搜尋"high low"

M0PB (Momentum Pullback)Long/short strategy that identifies extreme readings on the rsi as a *momentum signal*, unlike most RSI strategies the script will look to buy or sell the first pullback in the direction of the extreme RSI reading.
Enters positions on the first pullback to the 5ema(low)/ 5ema(high) and exits at rolling 12 bar high/ low. The rolling high/ low feature means that if the price enters into a prolonged consolidation the profit target will begin to reduce with each new bar. The best trades tend to work within 2-6 bars.
Built for use on 5 min intervals on FX, Indexes, and Crypto. Lower than 5 minute time frames tend to be noisier and mean more commissions and a higher risk of slippage so the suggested timeframe is 5 mins.
Hard stop is X ATR (users can experiment with this) from the position entry price. This can be adjusted in user inputs.
There is a lot of slack left in entries and exits but the overall strategy is fairly robust across timeframes and markets and has between 60%-70% win rate with larger winners.
Signals that occur from economic news volatility are best avoided.

Extended Recursive Bands StrategyThe original indicator was created by alexgrover .
All credit goes to alexgrover for creating the indicator that this strategy uses.
This strategy was posted because there were multiple requests for it, and no strategy based on this indicator exists yet.
The Recursive Bands Indicator, an indicator specially created to be extremely efficient, I think you already know that calculation time is extra important in algorithmic trading, and this is the principal motivation for the creation of the proposed indicator. Originally described in Alex's paper "Pierrefeu, Alex (2019): Recursive Bands - A New Indicator For Technical Analysis", the indicator framework has been widely used in his previous uploaded indicators, however it would have been a shame to not upload it, however user experience being a major concern for me, I decided to add extra options, which explain the term "extended".
The Indicator
The indicator displays one upper and one lower band, every common usages applied to bands indicators such as support/resistance , breakout, trailing stop, etc, can also be applied to this one. Length controls how reactive the bands are, higher values will make the bands cross the price less often.
In order to provide more flexibility for the user alexgrover added the option to use various methods for the calculation of the indicator, therefore the indicator can use the average true range , standard deviation, average high-low range, and one totally exclusive method specially designed for this indicator.
Added logic:
We have implemented a logic that checks whether the bands have been following in the same direction for a set amount of bars. This logic must be true before it can enter trades. This is completely new code that was written by us entirely, and it makes a huge difference on strategy performance.
Strategy Long conditions:
1 — Price low is below the the lower band.
2 — The lower band keeps increasing in value until the 'lookback' setting amount of bars is reached.
Strategy Short conditions:
1 — Price high is above the upper band.
2 — The upper band keeps decreasing in value until the 'lookback' setting amount of bars is reached.
Strategy Properties:
We have set a default commission of 0.06% because these are Bybit's fees. The strategy uses an order size of 10% of equity, since drawdown is very low like this. We also use a 10 tick slippage to keep results realistic and account for this. All other settings were left as default apart from initial capital, just to decrease the size of the numbers.

Coral Trend Pullback Strategy (TradeIQ)Description:
Strategy is taken from the TradeIQ YouTube video called "I Finally Found 80% Win Rate Trading Strategy For Crypto".
Check out the full video for further details/clarification on strategy entry/exit conditions.
The default settings are exactly as TradeIQ described in his video.
However I found some better results by some tweaking settings, increasing R:R ratio and by turning off confirmation indicators.
This would suggest that perhaps the current confirmation indicators are not the best options. I'm happy to try add some other optional confirmation indicators if they look to be more effective.
Recommended timeframe: 1H
Strategy incorporates the following features:
Risk management:
Configurable X% loss per stop loss
Configurable R:R ratio
Trade entry:
Based on strategy conditions below
Trade exit:
Based on strategy conditions below
Backtesting:
Configurable backtesting range by date
Trade drawings:
Each entry condition indicator can be turned on and off
TP/SL boxes drawn for all trades. Can be turned on and off
Trade exit information labels. Can be turned on and off
NOTE: Trade drawings will only be applicable when using overlay strategies
Alerting:
Alerts on LONG and SHORT trade entries
Debugging:
Includes section with useful debugging techniques
Strategy conditions
Trade entry:
LONG
C1: Coral Trend is bullish
C2: At least 1 candle where low is above Coral Trend since last cross above Coral Trend
C3: Pullback happens and price closes below Coral Trend
C4: Coral Trend colour remains bullish for duration of pullback
C5: After valid pullback, price then closes above Coral Trend
C6: Optional confirmation indicators (choose either C6.1 or C6.2 or NONE):
C6.1: ADX and DI (Single indicator)
C6.1.1: Green line is above red line
C6.1.2: Blue line > 20
C6.1.3: Blue trending up over last 1 candle
C6.2: Absolute Strengeh Histogram + HawkEye Volume Indicator (Two indicators combined)
C6.2.1: Absolute Strengeh Histogram colour is blue
C6.2.2: HawkEye Volume Indicator colour is green
SHORT
C1: Coral Trend is bearish
C2: At least 1 candle where high is below Coral Trend since last cross below Coral Trend
C3: Pullback happens and price closes above Coral Trend
C4: Coral Trend colour remains bearish for duration of pullback
C5: After valid pullback, price then closes below Coral Trend
C6: Optional confirmation indicators (choose either C6.1 or C6.2 or NONE):
C6.1: ADX and DI (Single indicator)
C6.1.1: Red line is above green line
C6.1.2: Blue line > 20
C6.1.3: Blue trending up over last 1 candle
C6.2: Absolute Strengeh Histogram + HawkEye Volume Indicator (Two indicators combined)
C6.2.1: Absolute Strengeh Histogram colour is red
C6.2.2: HawkEye Volume Indicator colour is red
NOTE: All the optional confirmation indicators cannot be overlayed with Coral Trend so feel free to add each separately to the chart for visual purposes
Trade exit:
Stop Loss: Calculated by recent swing low over previous X candles (configurable with "Local High/Low Lookback")
Take Profit: Calculated from R:R multiplier * Stop Loss size
Credits
Strategy origin: TradeIQ's YouTube video called "I Finally Found 80% Win Rate Trading Strategy For Crypto"
It combines the following indicators for trade entry conditions:
Coral Trend Indicator by @LazyBear (Main indicator)
Absolute Strength Histogram | jh by @jiehonglim (Optional confirmation indicator)
Indicator: HawkEye Volume Indicator by @LazyBear (Optional confirmation indicator)
ADX and DI by @BeikabuOyaji (Optional confirmation indicator)

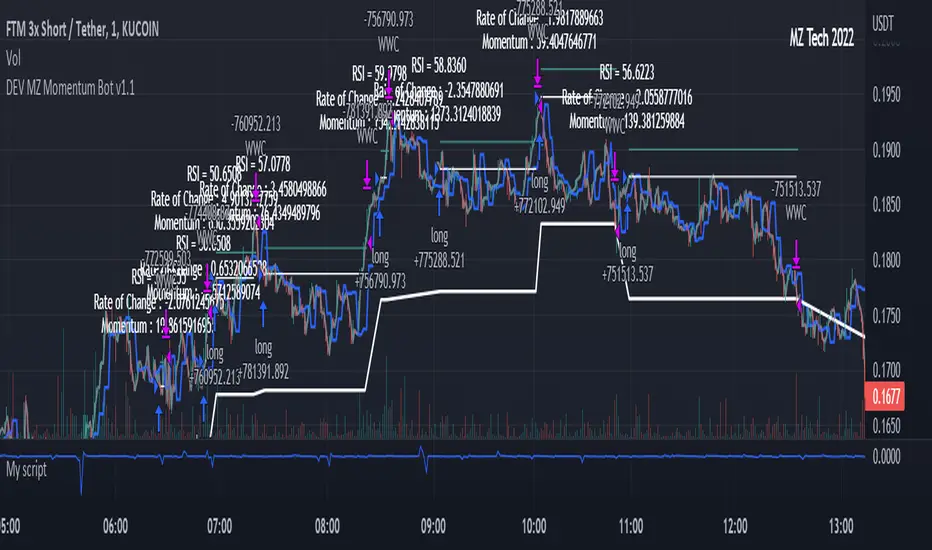
MZ Momentum Non Repainting HTF HFT Scalper BotThis is an original script meant to be a high frequency trader that works on higher time frame calculations. I came up with the idea that using calculus I can figure out the actual rate of change and momentum with different calculations than the momentum indicator that is provided by trading view. Once momentum is shifted on a small time frame, it will provide an entry signal. The script is meant to be used on an algorithmic trading system for scalping purposes. It should be run on a one minute time frame.
Set it up on a one minute chart - setup your bot on a one minute interval.
Find the source of your data. You can use any time frame, open, close. high, low, olc4. Open is pretty much guaranteed to not have any repainting issues - although all the other calcs use a custom isbarconfirmed security repaint calculation.
Set your rate of change period - typically I use a one minute time frame for this as well - but set my length fairly long (30-40).
Then set your period for momentum calculation. This will sample the rate of change data to figure out your momentum. I typically try a setting of 6-8. If that doesn't work, try setting it about the same as the rate of change period and add or subtract a few from there.
Unfortunately due to various plotting constraints in Pinescript, you cannot plot the rate of change and momentum and price in the same.
Set your trigger point. I try values -30, -20, -10, 0, 1. Then finesse to get an earlier entry signal. You should account for a slight delay from the signal to the actual entry. Your backtest should test well, but please note that does not gaurantee results. In my findings, I have seen that there is a slight minimal delay between signal to entry and that can make the difference whether your trade is profitable or not.
Use the show data to show you additional data when you are backtesting. This can allow you to try to filter out results or market conditions that do not work. I typically work with the RSI and use the 30 minute and 15 minute RSIs. I make sure that it is trading within a certain band - about 40-75. You can try the inverse and only buy during really low RSI's as well.
Use the enter and close messages to setup your webhook messages. But I recommend to allow the algo trading platform to close the trade for you based on their calcs since that platform knows the actual price level and when it has become profitable.
Filters have been setup for
Moving Average Variants - any time frame, any length.
RSI - Any time frame, any length,
Future Plans: ATR Filter so you can filter out low volatility periods.
Send me a message with any suggestions.
Double SupertrendThis strategy is based on a custom indicator that was created based on the Supertrend indicator. At its core, there are always 2 super trend indicators with different factors to reduce market noise (false signals).
The strategy/indicator has some parameters to improve the signals and filters.
TECHNICAL ANALYSIS
☑ Show Indicators
This option will enable/disable the Supertrend indicators on the chart.
☑ Length
The length will be used on the Supertrend Indicator to calculate its values.
☑ Dev Fast
The fast deviation or factor from one of the super trend indicators. This will be the leading indicator for entry signals, as well as for the exit signals.
☑ Dev Slow
The slow deviation or factor from one of the super trend indicators. This will be the confirmation indicator for entry and exit signals.
☑ Exit Type
It's possible to select from 4 options for the exit signals. Exit signals always take profit target.
☑ ⥹ Reversals
This option will make the strategy/indicator calculate the exit signals based on the difference between the given period's highest and lowest candle value (see Period on this list). It's displayed on the chart with the cross. As it's possible to verify in the image below, there are multiple exit spots for every entry.
☑ ⥹ ATR
Using ATR as a base indicator for exit signals will make the strategy/indicator place limit/stop orders. Candle High + ATR for longs, Candle Low - ATR for shorts. The strategy will show the ATR level for take profit and stick with it until the next signal. This way, the take profit value remains based on the candle of the entry signal.
☑ ⥹ Fast Supertrend
With this option selected, the exit signals will be based on the Fast Supertsignal value, mirrored to make a profit.
☑ ⥹ Slow Supertrend
With this option selected, the exit signals will be based on the Slow Supertsignal value, which is mirrored to take profit.
☑ Period
This will represent the number of candles used on the exit signals when Reversals is selected as Exit Type. It's also used to calculate the gradient used on the Fills and Supertrend signals.
☑ Multiplier
It's used on the take profit when the ATR option is selected on the Exit Type.
STRATEGY
☑ Use The Strategy
This will enable/disable the strategy to show the trades calculations.
☑ Show Use Long/Short Entries
Option to make the strategy show/use Long or Short signals. Available only if Use The Strategy is enabled
☑ Show Use Exit Long/Short
Option to make the strategy show/use Exit Long or Short signals (valid when Reversals option is selected on the Exit Type). Available only if Use The Strategy is enabled
☑ Show Use Add Long/Short
Option to make the strategy show/use Add Long or Short signals. With this option enabled, the strategy will place multiple trades in the same direction, almost the same concept as a pyramiding parameter. It's based on the Fast Supersignal when the candle fails to cross and reverses. Available only if Use The Strategy is enabled
☑ Trades Date Start/End
The date range that the strategy will check the market data and make the trades
HOW TO USE
It's very straightforward. A long signal will appear as a green arrow with a text Long below it. A short signal will appear as a red arrow with a text Short above it. It's ideal to wait for the candle to finish to validate the signal.
The exit signals are optional but give a good idea of the configuration used when backtesting. Each market and timeframe will have its own configuration for the best results. On average, sticking to ATR as an exit signal will have less risk than the other options.
☑ Entry Signals
Follow the arrows with Long/Short texts on them. Wait for the signal candle to close to validate the entry.
☑ Exit Signals
Use them to close your position or to trail stop your orders and maximize profits. Select the exit type suitable for each timeframe and market
☑ Add Entries
It's possible to increase the position following the add margin/contracts based on the Add signals. Not mandatory, but may work as reentries or late entries using the same signal.
☑ What about Stop Loss?
The stop-loss levels were not included as a separated signal because it's already in the chart. There are some possible ideas for the stop loss:
☑⥹ Candle High/Low (2nd recommend option)
When it's a Long signal from the entry signal candle, the stop loss can be the Low value of the same candle. Very tight stop loss in some cases, depending on the candle range
☑⥹ Local Top/Bottom
Selecting the local top/bottom as stop loss will give the strategy more room for false breakouts or reversals, keeping the trade open and minimizing noises. Increases the risk
☑⥹ Fast Supertrend (1st recommend option)
The fast supertrend can be used as stop-loss as well. making it a moving level and working close to trail stop management
☑⥹ Fixed Percentage
It's possible to use a fixed risk percentage for the trades, making the risk easier to control and project. Since the market volatility is not fixed, this may affect the accuracy of the trades
☑⥹ Based on the ATR (3rd recommend option)
When the exit type option ATR is selected, it will display the take profit level for that entry. Just mirror that value and put it as stop-loss, or multiply that amount by 1.5 to have more room for market noise.
EXAMPLE CONFIGURATIONS
Here are some configuration ideas for some markets (all of them are from crypto, especially futures markets)
BTCUSDT 15min - Default configuration
BTCUSDT 1h - Length 10 | Dev Fast 3 | Dev Slow 4 | Exit Type ATR | Period 50 | Multiplier 1
BTCUSDT 4h - Length 10 | Dev Fast 2 | Dev Slow 4 | Exit Type ATR | Period 50 | Multiplier 1
ETHUSDT 15min - Length 20 | Dev Fast 1 | Dev Slow 3 | Exit Type Fast Supertrend | Period 50 | Multiplier 1
IOTAUSDT 15min - Length 10 | Dev Fast 1 | Dev Slow 2 | Exit Type Slow Supertrend | Period 50 | Multiplier 1
OMGUSDT 15min - Length 10 | Dev Fast 1 | Dev Slow 4 | Exit Type Slow Supertrend | Period 50 | Multiplier 1
VETUSDT 15min - Length 10 | Dev Fast 3 | Dev Slow 4 | Exit Type Slow Supertrend | Period 50 | Multiplier 1
HOW TO FIND OTHER CONFIGURATIONS
Here are some steps to find suitable configurations
select a market and time frame
enable the Use This Strategy option on the strategy
open the strategy tester panel and select the performance summary
open the strategy configuration and go to properties
change the balance to the same price of the symbol (example: BTCUSDT 60.000, use 60.000 as balance)
go back to the inputs tab and keep changing the parameters until you see the net profit be positive and bigger than the absolute value of the drawdown
in case you can't find a suitable configuration, try other timeframes
Since the tester reflects what happened in the past candles, it's not guaranteed to give the same results. However, this indicator/Strategy can be used with other indicators as a leading signal or confirmation signal.

Alpha Candle Breakout Signal on Momentum from Support Resistance
Hello traders,
Let’s start with a brief description of what this strategy/indicator is and what it does and how we trade based on Alpha Candles.
The definition of an Alpha Candle is that it is mathematically calculated, and significantly bigger than the previous candles. This could be a green candle or a red candle, as long as the body is significantly bigger than the previous candles at the end of the calculation. All calculations are done in real time, we do NOT paint the candle sticks after the close of the candle and do not use offset values. This is extremely important. You will see the candle changing it's color as the body of the candle gets bigger with real time data feed. (Recalculate On Every Tick is ON by default). Now besides the mathematical calculations, an Alpha Candle also represents the emotion in the market for that stock in that moment. We can also say that an Alpha Candle is a change in the momentum.
Now that we’ve identified the Alpha candle, the second step is, to have a look at the chart and identify if the Alpha candle is breaking to a new high / low from a consolidation period, or from a good chart pattern (ascending / descending triangle , pennant , sideways consolidation) or a sudden direction change of the stock (bounce). Remember, the script will paint all Alpha candles regardless.
NVAX day trading example
Forex
Crypto
PLUG (Bounce example)
The script will identify the Alpha candles that are breaking to a new high / low from a user input look back period (default is 20 bars back, but this can be changed by the user input). An Alpha candle that breaks the look back period, will have a stop loss line below for Green Alpha or above for Red Alpha Candle and reward targets, like target1 or target2 (both are user input fields, can be adjusted to personal R values, default values are 2R and 3R)
A 2R means two times the reward (profit) of a 1-unit risk. If you are comfortable of loosing $50 per trade which will be considered 1-unit, then 2R means $100 reward (profit) target and a 3R is $150 reward (profit) target. Those R values will be plotted and/or labelled on the chart with dollar amounts if desired. You can change your R values from the user input area, even with decimal points, like 2.5R or 3.75R. If you shoot for at least 2R, you could be wrong 6 times out of 10, and still make 2R profit, as long as the other 4 trades give you a total of 8R. This is a basic trading concept. It will force the new traders to focus on risk/reward rather then a gambling attitude.
The script is meant to work with candle stick chart patterns only, it is NOT meant to work with ranges, line charts or point and figure charts. It will work with time frames like (seconds,1,2,3,5,10 minute or any minutes, daily, weekly). If you are trading IPOs , there might not be enough data for the script to do the calculation, so just be aware.
The script will identify the candles if they are Green Alpha (going up, bullish ) or Red Alpha (going down, bearish ). In order to see them clearly, we’ve greyed out the rest of the candles, and made Green Alpha candles white, and Red Alphas are left as red. You can change the colors from the user input area.
There is also a look back period, between 1-55 and the initial value is 20 for Green Alpha and 10 for Red Alpha. So, if the Alpha Candle breaks this look back period, it will be considered as an opportunity to take the trade. The code will put the stop loss area, possible target1 and target2 areas with a blue diamond and will draw the resistance/support lines for that Alpha candle. Depending on the individual’s risk tolerance, a label on the right side of the screen will show the risk tolerance (user input value) and the number of shares to be traded based on the risk tolerance (# of shares will be for the last Alpha Candle that is formed, it will constantly update itself with the new Alpha Candle)
For those who might be familiar with the three-bar play, we implemented something similar, so the code will find them in real time. Once an Alpha Candle is formed, if the following candle is a very small candle, also called pin bar , it will be painted to orange, so you can see it clearly. This pin bar is significantly smaller than the previous candles and formed right after an Alpha Candle.
Like anything in life, nothing is free. Meaning you have to work for it. So if you are looking to buy/sell blindly based on some indicators and signals, please do not consider this script. However, once you start using it, you will see how patterns repeat, when they repeat and how they repeat. It will identify the action, but you have to check the validity from the charts, so user discretionary is advised. As an example, if the Alpha candle is breaking from a consolidation period at $10. Let’s assume stop loss is at $9 so the 2R target will be $12, but if there is a possible resistance at $11, then the trader has to decide to take the trade for a possible 1R return, or skip the trade.
We try to approach the trading as a set of rules and processing the trades one by one, with a calculated risk and reward. This script will give you the Candle stick formation that is worth consideration and will draw the Stop Loss area (you can tweak this to your liking), will draw the 2-3R Targets, and will calculate the number of shares to be purchased based on the Risk Tolerance user entered in the user input area. The rest is to let the trade take care of it self.
Charts and patterns work better, when there is enough volume in a particular stock. If the stock is trading very low in volume , things will not work as expected. So, we must focus on the abnormal stocks, like gap gainers, volume gainer stocks, or heavily traded stocks (for intraday trading). For swing or long-term traders, one could look for a Green Alpha candle, assess the risk and possible return and trade the plan on a daily chart pattern (long term), or 15,30,60 min charts for swing trades.
If you are looking to short a stock, look for stocks that are weak (gap downs), so look for Red Alpha formations in that stock.
Once the back testing is turned on, code will generate buy/sell signals, otherwise it will work as an indicator. But please keep in mind….. For day trading, the stock has to be abnormally trading, so the chart patterns and the Alpha Candles work correctly. Volume has to be more than usual. It is the best way to have predictable results for day trading. If the volume of the stock is 2-5 times or more than the average of 20 days period (early in the morning), and even more later in the day, it is a good indication that the stock is trading on an abnormal volume with some news (pre-market abnormality is a good sign for possible abnormality for that stock).
For back testing, user can select from the user input area :
• Long or Short Trades or both or use the script as an indicator
• Close any open position if an Alpha candle forms in the opposite direction
• Pyramid the trades up to 4 levels (allow to buy/sell 4 times in the same direction every time another Alpha Candle forms)
• Breakout/breakdown look back period (every time an Alpha Candle forms and breaks this look back period, it will be a trade opportunity)
• Target Reward areas
• Stop Loss area
• Time frame (change the time frame and observe which time frame made good profit. Test the plan for future trades. Test it in as many abnormal stocks for the day they were behaving abnormal as possible). Time frame is not a user input field, just the time frame of the chart, 2,5,10 min, 1 hour etc.
• Selective date testing (between two dates/times). This is very important as most of the good opportunities comes from abnormal price action with volume . If you back test with the maximum amount of data for that abnormal stock on that day, it will produce unrealistic results, because the stock will have a normal course of trend before the news. Remember, we are looking for stocks that are trading abnormal in both price and volume or stocks like AAPL , TSLA which are trading heavily on each day. It is also a good way to learn, how and when to buy/sell, where to put stop losses by observing the chart with the Alpha Candles showing the results.
• All the above values will have an impact on the total profit / loss.
F (Ford Motors)
Now that we’ve covered what the script does, let’s plan the trade and trade the plan.
Side Note:
-------------
We started coding this as an indicator to show the Alpha Candles to find opportunities in the market. Later in the development, we implemented it as a Strategy, to be able to back test the ideas, to tweak some rules for entry/exit and see the effects on our profit/loss percentages in general. We kept the original idea being an Indicator, to show us the Alpha Candles in real time. This requires the option “Indicator Mode” is to be selected from the User Input area, and leaving the “Recalculate On Every Tick” is selected from the Properties tab of the strategy (as of Pine Script v5). Strategy is turning this “On” by default.
Disclaimer: This script is an educational and personal use only tool and should be used accordingly. User can not publish any images created with this code. Do your own due diligence, do not buy / sell stocks based on any indicator, always use stop losses. We do not make any promises as this indicator or any indicator will make you a profitable trader. Trading and technical analysis is difficult, it takes time to build confidence and experience. Study the charts and candlestick formations. Study support/resistance areas and how to identify them. This will help you to tweak the script’s stop loss areas and 2R-3R targets. Do not invest any money you are not comfortable loosing.
This is an invite only strategy. We will give ample time to test it out. After that you will need to subscribe. To get access to this strategy trader can send me an email from the links below.
All the Best
Happy Trading

Algonize Pivot Strategy (APS)This study is based on several Price Action parameters of :-
• Pivot Points,
• Higher High and Lower Lows,
• High Low Index ,
• Support and Resistance.
► How To Use This Strategy?
This is a pure scalping strategy and it is advised to use this only with algo trading systems. Due to high trade frequency.
► This Strategy has inbuilt custom time frame backtester, which enables you to test for performance between any date or check for a single day.
► To Create Alerts for algo trading in this strategy simply Check "Activate Algo" from Settings then Create new alert , select your strategy in condition box, and now scroll down to message box and write
{{strategy.order.comment}}
That's it , Just Click on Create Alert Button
Backtest Values Used:-
Initial Capital : 1000000
Order Size (Lots) : 1 (Contract) Lots
Pyramiding : 0 orders
Commission : 0.003%
Sharpe Ratio : 1.741
Profit Factor : 1.174
Test Yourself and give feedback.
PM us to obtain access.

Breakout Scalper (Session)This is a twist on my on my Breakout Scalper strategy that limits trading to a user-configurable session
Find the original "Continuous" version of the scalper here:
The breakout scalper is based on "slow" and "fast" donchian periods. In this version, the "slow" donchian is in fact the Day's high/low. This important difference means that we will always be entering our trades at the day's high or low, so you are exposed to the price making new highs/lows but not to oscillations within the day's range.
Furthermore, the scalper is modified to only enter trades after the start of the user-configured session. Any open trades are closed at the end of the user-configured session. The default session is set to 10:00 AM to 3:30 PM because that's when I like to trade.

RSI and Smoothed RSI Bull Div Strategy [BigBitsIO]This strategy focuses on finding a low RSI value, then targeting a low Smoothed RSI value while the price is below the low RSI in the lookback period to trigger a buy signal.
Features Take Profit, Stop Loss, and Plot Target inputs. As well as many inputs to manage how the RSI and Smoothed RSI are configured within the strategy.
Explanation of all the inputs
Take Profit %: % change in price from position entry where strategy takes profit
Stop Loss %: % change in price from position entry where strategy stops losses
RSI Lookback Period: # of candles used to calculate RSI
Buy Below Lowest Low In RSI Divergence Lookback Target %: % change in price from lowest RSI candle in divergence lookback if set
Source of Buy Below Target Price: Source of price (close, open, high, low, etc..) used to calculated buy below %
Smoothed RSI Lookback Period: # of candles used to calculate RSI
RSI Currently Below: Value the current RSI must be below to trigger a buy
RSI Divergence Lookback Period: # of candles used to lookback for lowest RSI in the divergence lookback period
RSI Lowest In Divergence Lookback Currently Below: Require the lowest RSI in the divergence lookback to be below this value
RSI Sell Above: If take profit or stop loss is not hit, the position will sell when RSI rises above this value
Minimum SRSI Downtrend Length: Require that the downtrend length of the SRSI be this value or higher to trigger a buy
Smoothed RSI Currently Below: Value the current SRSI must be below to trigger a buy

CBS Strategy with Trailing Stop _ IK3-Candle High/Low Breakout Strategy – Clean, Powerful, Fully Customizable (Pine Script v6)
A simple yet effective momentum breakout strategy that triggers trades when price closes above the highest high or below the lowest low of the previous 3 completed candles.
Perfect for trending markets (stocks, forex, crypto, indices) on any timeframe.
Key Features:
• Pure price-action breakout logic (no repainting)
• Long & Short entries with visual triangle signals
• Built-in Stop Loss & Take Profit (fixed % or ATR-based)
• Optional Trailing Stop (percentage or ATR multiplier)
• All risk parameters fully adjustable from the settings panel
• Clean on-chart visualization of SL, TP, and active trailing stop levels
• Works on all instruments and timeframes
Default Settings (2:1 Reward/Risk):
• Stop Loss: 1.5%
• Take Profit: 3.0%
• Trailing Stop: 1.0% (optional)
How to Use:
1. Add to chart
2. Adjust risk settings to match your style (fixed % or ATR)
3. Enable/disable trailing stop as needed
4. Backtest and optimize per instrument/timeframe
Fully open-source • No external libraries • Pine Script v6
Great for swing trading, intraday breakouts, or as a base for further enhancements.
Happy trading!

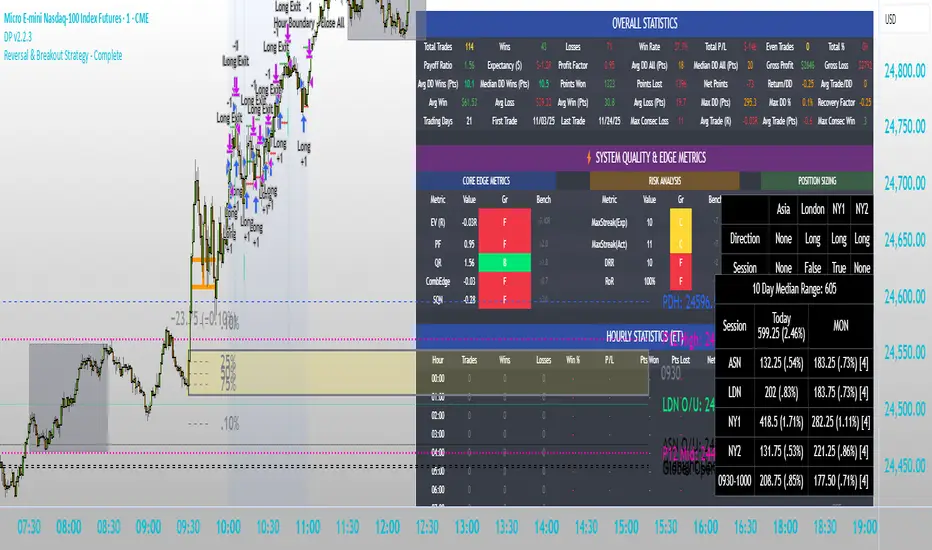
Intraday Market Structure Research Tool (Reversal + Breakout)This script is a fully rule-based intraday strategy designed for research and backtesting purposes, not financial advice. It is intended to help traders study market behavior, time-based price patterns, and statistical trade outcomes under realistic trading assumptions.
What the Strategy Does
This strategy operates in two selectable trade modes:
1. Reversal Mode
Identifies statistically large candles relative to recent volatility
Enters counter-direction trades when price shows exhaustion behavior
Designed to study fade-type behavior around session extremes
2. Breakout Mode
Tracks recent swing highs/lows over a user-defined lookback
Executes trades only after confirmed price expansion beyond these levels
Designed to test momentum continuation behavior
Time & Session Filtering
Trades are only taken during user-defined market sessions, including:
New York 1
New York 2
London
Asia
This allows users to analyze performance differences between global trading sessions.
9:30 AM Opening Range Logic
The script captures the 9:30 AM (Eastern) one-minute candle high/low and uses that as an Opening Range:
Breakout trades can be confirmed above or below this range
The range is visualized for clarity
Risk Management & Realism Controls
This script includes realistic execution mechanics:
Fixed stop-loss and take-profit defined by the user (points or ticks)
Built-in slippage modeling
Commission assumptions included
Position sizing designed to keep risk per trade under 5–10% of account equity when used with realistic account sizes
Users are responsible for choosing realistic account sizes and risk values when running backtests.
Statistical Performance Tracking
The strategy records and displays performance data including:
Win rate
Average win and loss
Maximum drawdown per trade series
Expectancy
Trade distribution by:
Time of day
Session
Market classification
This allows users to study market tendencies and structural behavior over large sample sizes.
Visual Tools
The script displays:
Entry and exit markers
Blocked trade labels (when conditions are not met)
Opening range box
Breakout levels
Use Case Disclaimer
This script is designed for:
Backtesting
Market structure research
Statistical study
It is not guaranteed to be profitable, and results depend heavily on user-selected settings, market conditions, and realistic brokerage assumptions.
D Money – EMA/TEMA Touch Strategy (Distance) What it’s trying to capture
You want mean-reversion “tags” back to a moving average after price has stretched away and momentum flips:
Bearish setup (short): price has been above EMA(9) for a few bars, then MACD turns bearish, and price is far enough above the EMA (by an adaptive threshold). Exit when price tags the EMA.
Bullish setup (long): price has been below your chosen TEMA rail (actually an EMA of 50/100/200 you pick) for a few bars, then MACD turns bullish, and price is far enough below that TEMA. Exit when price tags that TEMA.
The moving averages it uses
EMA(9) — your fast “tag” for short take-profits.
“TEMA line” input = one of EMA(50) / EMA(100) / EMA(200). (Labelled “Chosen TEMA” in the plot; it’s an EMA rail you pick.)
When it will enter trades
It requires four things per side:
Short (EMA-Touch Short)
MACD bearish cross on the signal bar
If “Require NO MA touch on cross bar” = true, the bar’s low must be above EMA(9), so it didn’t touch EMA on the cross bar (fake-out guard).
Extension/Context: you’ve had at least barsAbove consecutive closes above EMA(9) (default 3), so it’s truly stretched.
Distance test: absolute % distance from price to EMA(9) must be ≥ minDistEMA_eff (an adaptive threshold; details below).
Bounce filter: there was no bullish bounce off the EMA in the last bounceLookback bars (excluding the current one).
If all pass and you’re inside the backtest window → strategy.entry short.
Long (TEMA-Touch Long)
MACD bullish cross on the signal bar
With the same fake-out guard: the bar’s high must be below the chosen TEMA if the guard is on.
Extension/Context: at least barsAbove consecutive closes below the chosen TEMA.
Distance test: absolute % distance from price to TEMA must be ≥ minDistTEMA_eff (adaptive).
Bounce filter: there was no bearish bounce off the TEMA in the last bounceLookback bars.
If all pass and you’re in the window → strategy.entry long.
MACD timing option:
If Pure MACD Timing = ON, it only checks for the cross.
If OFF (default), it also enforces “no touch on the cross bar” if that checkbox is true. That’s your “fake-out” filter.
The adaptive distance threshold (the “secret sauce”)
You can choose how “far enough away” is determined—per side:
Fixed %
Short uses Fixed: Min distance ABOVE EMA (%)
Long uses Fixed: Min distance BELOW TEMA (%)
Auto (ATR%) (default)
Short threshold = max(floorEMA, kAtrShort × ATR%)
Long threshold = max(floorTEMA, kAtrLong × ATR%)
This scales distance by recent volatility, with a floor.
Auto (AvgDist%)
Short threshold = max(floorEMA, kAvgShort × average(|Dist to EMA|) over avgLen)
Long threshold = max(floorTEMA, kAvgLong × average(|Dist to TEMA|) over avgLen)
This adapts to the instrument’s typical stretch away from the rails.
These become minDistEMA_eff and minDistTEMA_eff and are re-computed each bar.
Fake-out / bounce logic (the “don’t get tricked” part)
A touch means the bar’s high/low overlapped the MA ± a small buffer % (touchBufPct).
A bounce is a touch plus a close on the “wrong” side (e.g., touch EMA and close above it on shorts = bullish bounce).
The script blocks entries if a bounce happened within bounceLookback bars (excluding the current signal bar).
Exits & risk
Take profit: when price touches the target MA:
Short TP = touch EMA(9)
Long TP = touch chosen TEMA
Stop loss: either
ATR stop: entry ± (atrMultStop × ATR) (default ON), or
Percent stop: entry × (1±stopPct%)
Time stop: if timeExitBars > 0, close after that many bars if still open.
Quality-of-life features
Backtest window (btFrom, btTo) so you can limit evaluation.
Labels on signal bars that show:
MACD bucket (Small/Moderate/HUGE/Violent — based on % separation on the bar),
the current absolute distance to the target MA,
and the effective minimum the engine used (plus which engine mode).
Data Window fields so you can audit:
abs distance to EMA/TEMA,
the effective min distance used on each side,
ATR%,
average absolute distances (for the AvgDist mode).
Alerts fire when a short/long signal is confirmed.
Optional debug panel to see the exact booleans & thresholds the bar had.
Quick mental model
Are we properly stretched away from the rail (by an adaptive threshold) and held on that side for a few bars?
Did MACD flip the way we want without price already tagging the rail that bar?
Have we avoided recent bounces off that rail (no fake-out)?
→ If yes, enter and aim for a tag back to the rail, with ATR/% stop and optional time stop.
If you want, I can add a simple on-chart “rating” (0–100) similar to your Python scorer (distance beyond min, MACD bucket, extension streak) so you can visually rank signals in TradingView too.

ORDER BLCOK custom strategy# OB Matrix Strategy - Documentation
**Version:** 1.0
**Author:** HPotter
**Date:** 31/07/2017
The **OB Matrix Strategy** is based on the identification of **bullish and bearish Order Blocks** and the management of conditional orders with multiple Take Profit (TP) and Stop Loss (SL) levels. It uses trend filters, ATR, and percentage-based risk management.
---
## 1. Main Parameters
### Strategy
- `initial_capital`: 50
- `default_qty_type`: percentage of capital
- `default_qty_value`: 10
### Money Management
- `rr_threshold`: minimum Risk/Reward threshold to open a trade
- `risk_percent`: percentage of capital to risk per trade (default 2%)
- `maxPendingBars`: maximum number of bars for a pending order
- `maxBarsOpen`: maximum number of bars for an open position
- `qty_tp1`, `qty_tp2`, `qty_tp3`: quantity percentages for multiple TPs
---
## 2. Order Block Identification
### Order Block Parameters
- `obLookback`: number of bars to identify an Order Block
- `obmode`: method to calculate the block (`Full` or `Breadth`)
- `obmiti`: method to determine block mitigation (`Close`, `Wick`, `Avg`)
- `obMaxBlocks`: maximum number of Order Blocks displayed
### Main Variables
- `bullBlocks`: array of bullish blocks
- `bearBlocks`: array of bearish blocks
- `last_bull_volume`, `last_bear_volume`: volume of the last block
- `dom_block`: dominant block type (Bullish/Bearish/None)
- `block_strength`: block strength (normalized volume)
- `price_distance`: distance between current price and nearest block
---
## 3. Visual Parameters
- `Width`: line thickness for swing high/low
- `amountOfBoxes`: block grid segments
- `showBorder`: show block borders
- `borderWidth`: width of block borders
- `showVolume`: display volume inside blocks
- `volumePosition`: vertical position of volume text
Customizable colors:
- `obHighVolumeColor`, `obLowVolumeColor`, `obBearHighVolumeColor`, `obBearLowVolumeColor`
- `obBullBorderColor`, `obBearBorderColor`
- `obBullFillColor`, `obBearFillColor`
- `volumeTextColor`
---
## 4. Screener Table
- `showScreener`: display the screener table
- `tablePosition`: table position (`Top Left`, `Top Right`, `Bottom Left`, `Bottom Right`)
- `tableSize`: table size (`Small`, `Normal`, `Large`)
The table shows:
- Symbol, Timeframe
- Type and status of Order Block
- Number of retests
- Bullish and bearish volumes
---
## 5. Trend Filters
- EMA as a trend filter (`emaPeriod`, default 223)
- `bullishTrend` if close > EMA
- `bearishTrend` if close < EMA
---
## 6. ATR and Swing Points
- ATR calculated with a customizable period (`atrLength`)
- Swing High/Low for SL/TP calculation
- `f_getSwingTargets` function to calculate SL and TP based on direction
---
## 7. Trade Logic
### Buy Limit on Bullish OB
- Conditions:
- New bullish block
- Uptrend
- RR > threshold (`rr_threshold`)
- SL: `bullishOBPrice * (1 - atr * atrMultiplier)`
- Multiple TPs: TP1 (50%), TP2 (80%), TP3 (100% max)
- Quantity calculation based on percentage risk
### Sell Limit on Bearish OB
- Conditions:
- New bearish block
- Downtrend
- RR > threshold (`rr_threshold`)
- SL: `bearishOBPrice * (1 + atr * atrMultiplier)`
- Multiple TPs: TP1 (50%), TP2 (80%), TP3 (100% max)
- Quantity calculation based on percentage risk
---
## 8. Order Management and Timeout
- Close pending orders after `maxPendingBars` bars
- Close open positions after `maxBarsOpen` bars
- Label management for open orders
---
## 9. Alert Conditions
- `bull_touch`: price inside maximum bullish volume zone
- `bear_touch`: price inside maximum bearish volume zone
- `bull_reject`: confirmation of bullish zone rejection
- `bear_reject`: confirmation of bearish zone rejection
- `new_bull`: new bullish block
- `new_bear`: new bearish block
---
## 10. Level Calculation
- Swing levels based on selected timeframe (`SelectPeriod`)
- `xHigh` and `xLow` for S1 and R1 calculation
- Levels plotted on chart
---
## 11. Take Profit / Stop Loss
- Extended horizontal lines (`extendBars`) to visualize TP and SL
- Customizable colors (`tpColor`, `slColor`)
---
## 12. Notes
- Complete script based on Pine Script v5
- Advanced graphical management with boxes, lines, labels
- Dynamically displays volumes and Order Blocks
- Integrated internal screener
---
### End of Documentation

AlgoIndex - All Stages (AM & Mid-Day Long/Short)Scope (read first)
ES1! on 5-minute only. The strategy backtests ES fills; alerts can post JSON messages to a Webhook URL you configure. Exits are target-based with ITTC - if ES touches target intra-bar, an exit alert is sent immediately. No fixed ES stop-loss. Positions can also exit at scheduled time-based safety closes (session end, holiday/half-day, or expiration end). You can always close manually.
What this is
One intraday engine with four session presets (“Stages”). Stages only change session windows, trade side, and a few risk/confirmation governors—the core logic is the same. Single invite-only listing; not a multi-post suite.
How it trades
Opening Range (OR): Each Stage begins with a short OR at its session start; that Stage won’t take entries until its OR closes.
VWAP alignment: Trade with flow. Price must align with VWAP (simple pass/fail; optional gap offset).
Real breakouts only: A composite “impulse” check looks for volume expansion, recent momentum, ATR-scaled range, body/range quality, and a clean OR break (or a gap-aware extension).
Entry & target: Entries occur on the signal bar’s close; targets are set in underlying (ES) units.
ITTC (close on touch): If ES touches target intra-bar, ITTC sends a one-shot exit.
Adds (preset by Stage): S1/S2/S3 allow up to two adds on defined ES retraces; S4 disables adds. Adds use a fixed scale-out policy handled internally—no user input required.
Time-based safety closes: At the configured session end (and on holiday/half-day or expiration when applicable), any open position is closed. These are time exits, not price stops.
Why traders use it
A progressive filter for intraday continuity: OR context → VWAP alignment → authentic breakout (impulse) → ITTC to sync ES triggers with options execution. Stage-governed adds keep scaled positions coherent from open to close.
Stages (session templates; one engine)
S1 — 09:30–11:20 NY, Long-only. Standard impulse; adds ON.
S2 — 09:30–11:30 NY, Short-only. Tighter breakout standard; adds ON.
S3 — 11:15–15:15 NY, Long-only. Trade-protection ON; slightly lower underlying target; adds ON.
S4 — 11:30–14:30 NY, Short-only. Alternative trigger governor; slightly lower underlying target; adds OFF.
You can replicate any Stage via session times, side, and thresholds; presets exist for convenience and auditability.
Public inputs (what you can adjust)
Contracts (order size)
TP (Underlying) and TP (Options)
Trade Limiter (toggle) + Max profitable trades per session
Session settings: Exchange Day Session times, optional Custom Time Zone, Session 1 times, optional Session 2, and day-of-week checkboxes
Visual overlays (display-only): VWAP, Prior-Day High/Low, Session High/Low, Round Numbers, Bias Banner, Trade Markers
Display: Inputs in status line
Alerts (how to use)
Create an alert on this strategy and select “Any alert() function call.” (Optional) add a Webhook URL you control to receive the JSON the script sends. Leave Message empty.
Backtest vs options (read carefully)
Backtests show ES fills on 5-minute bars; options pricing (IV, DTE, spreads, partial fills) isn’t simulated. Because live execution uses options, ES PnL is a directional proxy only.
Evaluate quality via: trade count (target ≥100), win rate, average time-in-trade, MAE/MFE, and holding-time distribution. Do not read ES $ PnL as expected options returns—actual options outcomes depend on strike/DTE, IV regime, spreads, and execution.
Defaults used in this publication (match these before interpreting results)
Dataset: last 12–24 months of ES1! 5-minute RTH (to ensure ≥100 trades)
Initial capital: $25,000
Commission: $1.00 per order per contract (≈ $2 round-trip)
Slippage: 1 tick
Order size: 1 contract; pyramiding only for Stage-governed adds
No fixed ES stop-loss; exits are target-based with ITTC and scheduled safety closes
Operating notes
ES1! symbol only; 5-minute resolution only
You can run multiple Stages in parallel via separate tabs/alerts; if you want a single net position across Stages, enforce it in your own tooling (e.g., ignore new orders while a position is open)
Use a clean chart when publishing (only this strategy active)
Keep results separate by using four TradingView tabs (one per Stage)
Disclosures
Educational research tool, not financial advice. Past or hypothetical performance does not guarantee future results. Trading involves risk, including the risk of loss. Test thoroughly and use at your own discretion.

💎🔺⚫ Diamond-Triangle-Circle StrategyUpgrade the high low low high strat to cut out signal noise and flat markets dont take the black circles they eat profits

Sr.Rma.Prev High/lows with Alerts
Disclaimer: This chart is designed for educational purposes only. Please conduct your own due diligence before entering any trades.
The strategy is based on previous highs and lows, combined with stop-loss and reversal percentage logic. It is most effective on SPY and QQQ using the 1-minute time-frame, where I personally trade next-day expiration with preset configurations.
If you choose to apply it to other stocks, be sure to adjust the stop-loss % and re-entry % parameters to match your trading style and risk tolerance.

Gann Fan Strategy [KedarArc Quant]Description
A single-concept, rule-based strategy that trades around a programmatic Gann Fan.
It anchors to a swing (or a manual point), builds 1×1 and related fan lines numerically, and triggers entries when price interacts with the 1×1 (breakout or bounce). Management is done entirely with the fan structure (next/previous line) plus optional ATR trailing.
What TV indicators are used
* Pivots: `ta.pivothigh/ta.pivotlow` to confirm swing highs/lows for anchor selection.
* ATR: `ta.atr` only to scale the 1×1 slope (optional) and for an optional trailing stop.
* EMA: `ta.ema` as a trend filter (e.g., only long above the EMA, short below).
No RSI/MACD/Stoch/Heikin/etc. The logic is one coherent framework: Gann price–time geometry, with ATR as a scale and EMA as a risk filter.
How it works
1. Anchor
* Auto: chooses the most recent *confirmed* pivot (you control Left/Right).
* Manual: set a price and bar index and the fan will hold that point (no re-anchoring).
* Optional Re-anchor when a newer pivot confirms.
2. 1×1 Slope (numeric, not cosmetic)
* ATR mode: `1×1 = ATR(Length) × Multiplier` (adapts to volatility).
* Fixed mode: `ticks per bar` (constant slope).
Because slope is numeric, it doesn’t change with chart zoom, unlike the drawing tool.
3. Fan Lines
Builds classic ratios around the 1×1: 1/8, 1/4, 1/3, 1/2, 1/1, 2/1, 3/1, 4/1, 8/1.
4. Signals
* Breakout: cross of price over/under the 1×1 in the EMA-aligned direction.
* Bounce (optional): touch + reversal across the 1×1 to reduce whipsaw.
5. Exits & Risk
* Take-profit at the next fan line; Stop at the previous fan line.
* If a level is missing (right after re-anchor), a fallback Risk-Reward (RR) is used.
* Optional ATR trailing stop.
Why this is unique
* True numeric fan: The 1×1 slope is calculated from ATR or fixed ticks—not from screen geometry—so it is scale-invariant and reproducible across users/timeframes.
* Deterministic anchor logic: Uses confirmed pivots (with your L/R settings). No look-ahead; anchors update only when the right bars complete.
* Fan-native trade management: Both entries and exits come from the fan structure itself (with a minimal ATR/EMA assist), keeping the method pure.
* Two entry archetypes: Breakout for momentum days; Bounce for range days—switchable without changing the core model.
* Manual mode: Lock a session’s bias by anchoring to a chosen swing (e.g., day’s first major low/high) and keep the fan constant all day.
Inputs (quick guide)
* Auto Anchor (Left/Right): pivot sensitivity. Higher values = fewer, stronger anchors.
* Re-anchor: refresh to newer pivots as they confirm.
* Manual Anchor Price / Bar Index: fixes the fan (turn Auto off).
* Scale 1×1 by ATR: on = adaptive; off = use ticks per bar.
* ATR Length / ATR Multiplier: controls adaptive slope; start around 14 / 0.25–0.35.
* Ticks per bar: exact fixed slope (match a hand-drawn fan by computing slope ÷ mintick).
* EMA Trend Filter: e.g., 50–100; trades only in EMA direction.
* Use Bounce: require touch + reverse across 1×1 (helps in chop).
* TP/SL at fan lines; Fallback RR for missing levels; ATR Trailing Stop optional.
* Transparency/Plot EMA: visual preferences.
Tips
* Range days: larger pivots (L/R 8–12), Bounce ON, ATR Multiplier \~0.30–0.40, EMA 100.
* Trend days: L/R 5–6, Breakout, Multiplier \~0.20–0.30, EMA 50, ATR trail 1.0–1.5.
* Match the TV Gann Fan drawing: turn ATR scale OFF, set ticks per bar = `(Δprice between anchor and 1×1 target) / (bars) / mintick`.
Repainting & testing notes
* Pivots require Right bars to confirm; anchors are set after confirmation (no look-ahead).
* Signals use the current bar close with TradingView strategy mechanics; real-time vs. bar-close can differ slightly, as with any strategy.
* Re-anchoring legitimately moves the structure when new pivots confirm—by design.
⚠️ Disclaimer
This script is provided for educational purposes only.
Past performance does not guarantee future results.
Trading involves risk, and users should exercise caution and use proper risk management when applying this strategy.

US30 Stealth StrategyOnly works on US30 (CAPITALCOM) 5 Minute chart
📈 Core Concept:
This is a trend-following strategy that captures strong market continuations by entering on:
The 3rd swing in the current trend,
Confirmed by a volume-verified engulfing candle,
With adaptive SL/TP and position sizing based on risk.
🧠 Entry Logic:
✅ Trend Filter
Uses a 50-period Simple Moving Average (SMA).
Buy only if price is above SMA → Uptrend
Sell only if price is below SMA → Downtrend
✅ Swing Count Logic
For buy: Wait for the 3rd higher low
For sell: Wait for the 3rd lower high
Uses a 5-bar lookback to detect highs/lows
This ensures you’re not buying early — but after trend is confirmed with structure.
✅ Engulfing Candle Confirmation
Bullish engulfing for buys
Bearish engulfing for sells
Candle must engulf previous bar completely (body logic)
✅ Volume Filter
Current candle volume must be greater than the 20-period volume average
Ensures trades only occur with institutional participation
✅ MA Slope Filter
Requires the slope of the 50 SMA over the last 3 candles to exceed 0.1
Avoids chop or flat trends
Adds momentum confirmation to the trade
✅ Session Filter (Time Filter)
Trades only executed between:
2:00 AM to 11:00 PM Oman Time (UTC+4)
Helps avoid overnight chop and illiquidity
📊 Position Sizing & Risk Management
✅ Smart SL (Adaptive Stop Loss)
SL is based on full size of the signal candle (including wick)
But if candle is larger than 25 points, SL is cut to half the size
This prevents oversized risk from long signals during volatile moves.

Multi-Timeframe Wolfe Wave StrategyThis invite-only strategy implements an advanced multi-timeframe Wolfe Wave pattern recognition system specifically designed for institutional-grade algorithmic trading environments.
**Core Mathematical Framework:**
The strategy employs sophisticated mathematical calculations across 10 distinct timeframes (377, 233, 144, 89, 55, 34, 21, 13, 8, 5 periods), utilizing Elliott Wave ratio theory combined with proprietary algorithmic enhancements. Unlike standard Wolfe Wave implementations that rely on visual pattern recognition, this system uses quantitative analysis to identify precise entry and exit points.
**Technical Implementation:**
• **Pattern Detection Algorithm:** Calculates price relationships using configurable ratio sets including Fibonacci sequences, Elliott Wave ratios, Golden Ratio, Harmonic Patterns, Pi-based calculations, and custom mathematical progressions
• **Multi-Timeframe Confluence:** Simultaneously analyzes patterns across all timeframes to ensure signal reliability and reduce false positives
• **Dynamic Target Calculation:** Employs advanced mathematical modeling to project optimal profit targets based on historical price behavior and pattern completion theory
• **Risk Management Engine:** Implements position-based stop losses calculated as percentages of target profits, with liquidation price monitoring for leveraged positions
**Originality and Innovation:**
This implementation differs significantly from traditional Wolfe Wave indicators through several key innovations:
1. **Algorithmic Pattern Validation:** Uses mathematical confirmation across multiple timeframes rather than subjective visual analysis
2. **Adaptive Ratio Selection:** Offers 24 different ratio calculation methods, allowing optimization for various market conditions
3. **Institutional Integration:** Features comprehensive webhook messaging for automated execution via external trading systems
4. **Advanced Position Management:** Includes sophisticated position sizing controls with maximum concurrent position limits
**Strategy Logic:**
For bullish conditions, the algorithm identifies when price action meets specific mathematical criteria:
- Point validation through ratio analysis between swing highs/lows
- Confluence confirmation across multiple timeframes
- Minimum profit threshold filtering to ensure trade quality
- Dynamic stop-loss positioning based on pattern geometry
The mathematical approach uses proprietary calculations that extend beyond traditional Fibonacci levels, incorporating elements from chaos theory, fractal geometry, and advanced statistical analysis.
**Risk Management Features:**
• Configurable stop-loss percentages relative to profit targets
• Maximum position limits to control portfolio exposure
• Liquidation price monitoring for margin trading
• Time-based filtering options for market session control
• Minimum profit threshold settings to filter low-quality signals
**Intended Markets and Conditions:**
Optimized for cryptocurrency markets with high volatility and sufficient liquidity. Works effectively in trending and ranging market conditions due to its multi-timeframe approach. Best suited for assets with clear swing structure and adequate price movement.
**Performance Characteristics:**
The strategy is designed for active trading with frequent position entries across multiple timeframes. Position holding periods vary from short-term scalping to medium-term swing trading depending on pattern completion timeframes.
**Technical Requirements:**
Requires understanding of advanced pattern recognition theory, risk management principles, and algorithmic trading concepts. Users should be familiar with Wolfe Wave methodology and Elliott Wave theory fundamentals.

Volume and Volatility Ratio Indicator-WODI策略名称
交易量与波动率比例策略-WODI
一、用户自定义参数
vol_length:交易量均线长度,计算基础交易量活跃度。
index_short_length / index_long_length:指数短期与长期均线长度,用于捕捉中短期与中长期趋势。
index_magnification:敏感度放大倍数,调整指数均线的灵敏度。
index_threshold_magnification:阈值放大因子,用于动态过滤噪音。
lookback_bars:形态检测回溯K线根数,用于捕捉反转模式。
fib_tp_ratio / fib_sl_ratio:斐波那契止盈与止损比率,分别对应黄金分割(0.618/0.382 等)级别。
enable_reversal:反转信号开关,开启后将原有做空信号反向为做多信号,用于单边趋势加仓。
二、核心计算逻辑
交易量百分比
使用 ta.sma 计算 vol_ma,并得到 vol_percent = volume / vol_ma * 100。
价格波动率
volatility = (high – low) / close * 100。
构建复合指数
volatility_index = vol_percent * volatility,并分别计算其短期与长期均线(乘以 index_magnification)。
动态阈值
index_threshold = index_long_ma * index_threshold_magnification,过滤常规波动。
三、信号生成与策略执行
做多/做空信号
当短期指数均线自下而上突破长期均线,且 volatility_index 突破 index_threshold 时,发出做多信号。
当短期指数均线自上而下跌破长期均线,且 volatility_index 跌破 index_threshold 时,发出做空信号。
反转信号模式(可选)
若 enable_reversal = true,则所有做空信号反向为做多,用于在强趋势行情中加仓。
止盈止损管理
进场后自动设置斐波那契止盈位(基于入场价 × fib_tp_ratio)和止损位(入场价 × fib_sl_ratio)。
支持多级止盈:可依次以 0.382、0.618 等黄金分割比率分批平仓。
四、图表展示
策略信号标记:图上用箭头标明每次做多/做空(或反转加仓)信号。
斐波那契区间:在K线图中显示止盈/止损水平线。
复合指数与阈值线:与原版相同,在独立窗口绘制短、长期指数均线、指数曲线及阈值。
量能柱状:高于均线时染色,反转模式时额外高亮。
Strategy Name
Volume and Volatility Ratio Strategy – WODI
1. User-Defined Parameters
vol_length: Length for volume SMA.
index_short_length / index_long_length: Short and long MA lengths for the composite index.
index_magnification: Sensitivity multiplier for index MAs.
index_threshold_magnification: Threshold multiplier to filter noise.
lookback_bars: Number of bars to look back for pattern detection.
fib_tp_ratio / fib_sl_ratio: Fibonacci take-profit and stop-loss ratios (e.g. 0.618, 0.382).
enable_reversal: Toggle for reversal mode; flips short signals to long for trend-following add-on entries.
2. Core Calculation
Volume Percentage:
vol_ma = ta.sma(volume, vol_length)
vol_percent = volume / vol_ma * 100
Volatility:
volatility = (high – low) / close * 100
Composite Index:
volatility_index = vol_percent * volatility
Short/long MAs applied and scaled by index_magnification.
Dynamic Threshold:
index_threshold = index_long_ma * index_threshold_magnification.
3. Signal Generation & Execution
Long/Short Entries:
Long when short MA crosses above long MA and volatility_index > index_threshold.
Short when short MA crosses below long MA and volatility_index < index_threshold.
Reversal Mode (optional):
If enable_reversal is on, invert all short entries to long to scale into trending moves.
Fibonacci Take-Profit & Stop-Loss:
Automatically set TP/SL levels at entry price × respective Fibonacci ratios.
Supports multi-stage exits at 0.382, 0.618, etc.
4. Visualization
Signal Arrows: Marks every long/short or reversal-add signal on the chart.
Fibonacci Zones: Plots TP/SL lines on the price panel.
Index & Threshold: Same as v1.0, with MAs, index curve, and threshold in a separate sub-window.
Volume Bars: Colored when above vol_ma; extra highlight if a reversal-add signal triggers

SMPivot Gaussian Trend Strategy [Js.K]This open-source strategy combines a Gaussian-weighted moving average with “Smart Money” swing-pivot breaks (BoS = Break-of-Structure) to capture trend continuations and early reversals. It is intended for educational and research purposes only and must not be interpreted as financial advice.
How the logic works
-------------------
1. Gaussian Moving Average (GMA)
• A custom Gaussian kernel (length = 30 by default) smooths price while preserving turning points.
• A second pass (“Smoothed GMA”) further filters noise; only its direction is used for bias.
2. Swing-Pivot detection
• High/Low pivots are found with a symmetric look-back/forward window (Pivot Length = 20).
• The most recent confirmed pivot creates a dynamic structure level (UpdatedHigh / UpdatedLow).
3. Entry rules
Long
• Price closes above the most recent pivot high **and** above Smoothed GMA.
Short
• Price closes below the most recent pivot low **and** below Smoothed GMA.
4. Exit rules
• Fixed stop-loss and take-profit in percent of current price (user-defined).
• Separate parameters and on/off switches for longs and shorts.
5. Visuals
• GMA (dots) and Smoothed GMA (line).
• Structure break lines plus “BoS PH/PL” labels at the midpoint between pivot and break.
Inputs
------
Gaussian
• Gaussian Length (default 30) – smoothing window.
• Gaussian Scatterplot – toggle GMA dots.
Smart-Money Pivot
• Pivot Length (default 20).
• Bull / Bear colors.
Risk settings
• Long / Short enable.
• Individual SL % and TP % (default 1 % SL, 30 % TP).
• Strategy uses percent-of-equity sizing; initial capital defaults to 10 000 USD.
Adjust these to reflect your own account size, realistic commission and slippage.
Best practice & compliance notes
--------------------------------
• Test on a data sample that yields ≥ 100 trades to obtain statistically relevant results.
• Keep risk per trade below 5–10 % of equity; the default values comply with this guideline.
• Explain any custom settings you publish that differ from the defaults.
• Do **not** remove the code header or licence notice (MPL-2.0).
• Include realistic commission and slippage in your back-test before publishing.
• The script does **not** repaint; orders are processed on bar close.
Usage
-----
1. Add the script to any symbol / timeframe; intraday and swing timeframes both work—adjust lengths accordingly.
2. Configure SL/TP and position size to match your personal risk management.
3. Run “List of trades” and the performance summary to evaluate expectancy; forward-test before live use.
Disclaimer
----------
Trading involves substantial risk. Past performance based on back-testing is not necessarily indicative of future results. The author is **not** responsible for any financial losses arising from the use of this script.

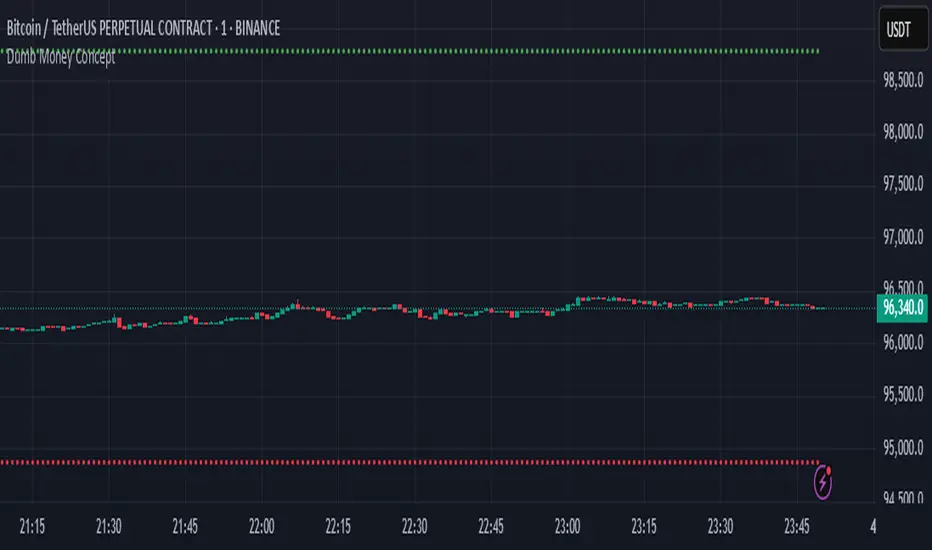
Dumb Money ConceptUse in 1 minute timeframe
1. Strategy setup
Name & sizing: Trades 25% of your account on each signal, assumes 0.04% commission + 2‑tick slippage, starts with a notional 10 million.
Timing: Only makes decisions at each 1‑minute bar close, and processes orders at bar‑close.
2. Optional filters (both default to off)
Volatility filter : when on, requires that yesterday’s ATR (average true range) ≥ your threshold before even placing an entry.
Trend filter : when on, only allows a “long” if yesterday’s close was above its daily MA, or a “short” if below.
You can toggle each filter on/off and adjust ATR period, ATR threshold, and MA length through the inputs at the top.
3. Signal logic (“dumb money” wicks)
At today’s first minute, the script pulls yesterday’s open, high, low, close, ATR and MA—using only completed daily bars so nothing repaints.
It measures the size of yesterday’s upper wick (close→high) vs. lower wick (open→low).
If the upper wick was longer, that sets a long bias (“dumb money” got shaken out at the top). Otherwise it sets a short bias.
4. Calculate where to place orders
On that same first minute of day:
Entry: a limit order at half of yesterday’s range away from today’s open (below the open for longs, above for shorts).
Stop‑loss: one full‑range (×1.0) below today’s open for longs (and above for shorts).
Take‑profit: 1.236× yesterday’s range above today’s open for longs (and below for shorts).
5. Apply filters before sending entry
Before actually placing that limit order, it checks:
Volatility: if enabled, requires yesterday’s ATR ≥ your “Min Daily ATR.”
Trend: if enabled, requires yesterday’s close to lie on the same side of its daily MA as your signal.
If either filter fails, no order is sent.
6. Give the limit order up to 24 hours to fill
The code remembers the bar‑index when the order went live.
If 1440 one‑minute bars pass (≈24 h) without a fill, it automatically cancels the unfilled entry—so stale orders don’t hang around.
7. Once filled, TP/SL manage the trade
As soon as your limit order executes, two opposite orders are placed:
A take‑profit at the 1.236× range level
A stop‑loss at the –1.0× range level
One cancels the other when triggered.
8. No overnight risk
On the very first minute of the next daily bar, any position still open is force‑closed (“Time Exit”)